Our data concentrators and gateways are normally used to read out, record, and save data from meters, and transmit them onwards to other systems. This allows invoicing, monitoring, or even controlling plants and processes based on meter data.
The key point here is that users must be able to rely on the proper delivery of data by our data concentrators. And, until now, it has not been possible to monitor these data directly themselves. We are now providing a new firmware as a tool which helps to do this.
Our new firmware is now proposed with a so-called system meter. Just like a normal meter, it makes available several essential status characteristics of a device.
So, let us simply add this system meter. Click on “Add” in the meter tab on the data concentrator website to open an input window
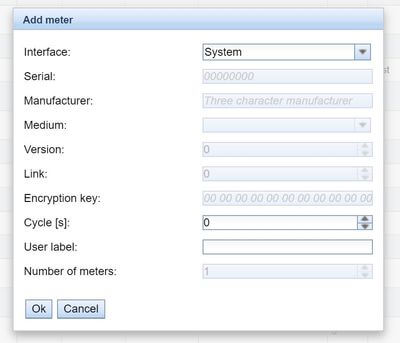
Then, a new meter with the “System” interface will appear in the meter list. Its meter number corresponds to the last eight digits of your device’s MAC address. This allows to assign the monitoring data in a control system in a way similar to one applied for meters at a later time.
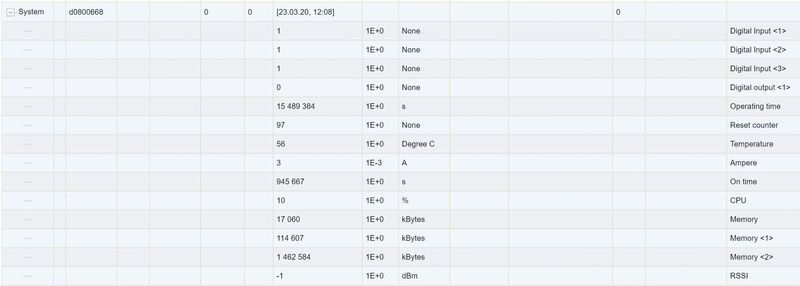
Let us go on and have a look at the details and at the “meter values” of the system now. When you expand the meter, you can see a certain number of values. The specific values shown depend on the type of device. What they all have in common is:
- Runtime after the last reboot (on time)
- CPU load (CPU)
- Available RAM (memory)
- Flash available for program partition (Memory <1>)
- Flash available for log partition (Memory <2>)
This allows to record the most important status parameters. Monitoring them can help, e.g. to trigger an alarm when the memory load reaches a critical state. Or it is also possible to monitor whether a restart has taken place (in this case, on time would be counted from zero again).
MUC.easyplus provides significantly more system parameters:
- Status of S0 inputs (digital input <..>, momentarily shorted “0”, or open “1”)
- Digital output status (digital output <1>)
- Operating seconds meter (operation time)
- Number of service interruptions (reset counter)
- Temperature inside the casing (temperature at one point of the assembly, gross indicator)
- Current on the M bus (amperes)
- Field strength of the WAN modem (RSSI
This opens up far-reaching possibilities, including, e.g.:
- Use the S0 meter inputs as status inputs (e.g. switching contact, leak sensor)
- Check standard loads on the M-Bus
- Check the history of WAN field strength
Here are some examples for applications known to us:
First of all, it is important to have data which are recordable. Any other application still possible will then be developed so as to respond to your requirements.
Device monitoring via system meter
PDF | 176 kB