Our devices have a web-based configuration interface, which enables parameterizing the devices via a browser. For the management and maintenance of multiple devices in the network, including updates, we have the tool Netdiscover. But how to monitor many devices automatically during operation?
One approach is based on the system logs of the devices.
In our latest firmware, the 1.35, it will be possible to transfer the system log to a specialized log management system, in order to analyse it automatically. We demonstrate this functionality on our data logger MUC.easyplus and the log management system Graylog.
The first part of this blog post is about how to carry out the necessary configuration of MUC.easyplus and Graylog.
But what is Graylog exactly?
Almost every software producer saves logs in its own format and these are not always easily accessible or even analysable via corresponding interfaces. This task is taken over by log management systems like Graylog, which collect the log files in a central place and enable evaluation beyond system boundaries.
Graylog is an open source log management system for collecting, indexing, analysing and searching of system events/log data.
It saves the logs and facilitates the fast browsing of even very large databases with a powerful search and analysis tool. This makes Graylog also especially suitable for searching specific system events or indications.
This offers us and our customers the possibility to centrally monitor the system events of our products and to generate alarms or something similar from certain log incidents. This could be, for example, a notification for meters that could not be read out during the last readout period or a failed data transmission to a third-party system. It is also conceivable to check the mobile communications dial-up to the MUC.easyplus 4G.
The generation of alarms will be explained in the second part of this blog post. But first, we take a look at the configuration.
Configuration Graylog
A Graylog system has already been set up for testing. The installation guide can be found here: https://docs.graylog.org/en/4.1/pages/installation.html.
You can also set up and test Graylog as a virtual machine with Oracle or VMWare. For this purpose, Graylog offers turnkey appliances, which can be downloaded from the following link:
https://packages.graylog2.org/appliances.
This appliance can be imported and started in Oracle and VMWare.
Now, let us take a look at the Graylog web interface.
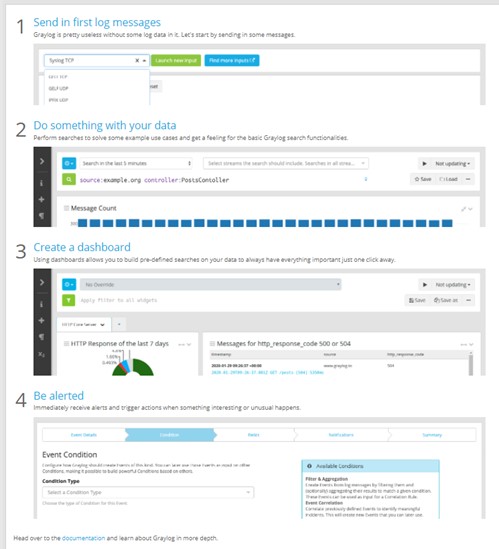
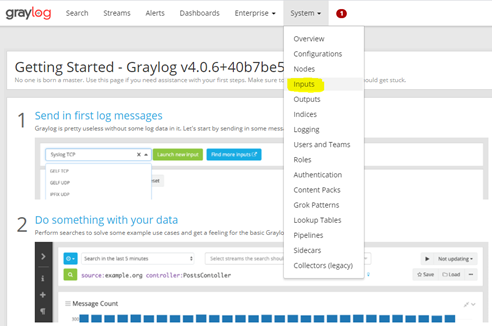
First, you see a short “Getting Started”, where the first steps are shown and explained. The first step describes how the data is transferred from MUC.easyplus to Graylog. For this purpose, an input must be created and configured. To do this, go to “System” -> “Inputs“.
Create input
Our MUC.easyplus transfer the data via TCP. How this is configured, can be seen below. Therefore, select “Syslog TCP“ in the “Select Input“ drop-down menu.

Configuration of the input
After clicking on “Launch Input”, a configuration window appears. Here, you can enter the name of the input, the IP address of the server and any free TCP port that you want to use for the transfer. In the menu are also some optional settings and the configuration for TLS, which we skip at this point.

After confirming the configuration, the first input is successfully created.

Now click on “Show received messages“.

As expected, it now looks slightly empty here. So let us start with the configuration of the data transmission on the MUC.easyplus.
Configuration of the data transmission (report)
Go to the tab “Server“ on the configuration website of MUC.easyplus. Select “System log” under “Report format” and set a report interval every minute. Under “Report address“ the IP address and the port are entered, which were configured in the input. To generate more log messages, change the “Log mode” in tab “General” from “Standard” to “All”.

Nothing more needs to be configured at this point.

It is done! The basic configuration is complete. System messages are now reported or transferred from MUC.easyplus to Graylog.
In the next part, we will show how to search for specific log messages in the input and generate alarms.